ECharts柱状图相关功能点
highlight: a11y-dark theme: cyanosis
记录一下在公司遇到的一些功能,以及相关实现
经过之前环形图需求,对ECharts的使用感觉已经非常熟练了,这次写柱状图的时候就快了很多。
在这里还是力推一下这个ECharts图表集,大部分的灵感都来自于这 ^_^
等会讲具体功能的时候,也会将一些具体的案例提供给大家
柱状样式
首先,我给大家提供一种柱状图样式,个人感觉不错,而且实现也很简单
看着很酷,实现也很简单,只需要改变一下柱状的color即可,改为渐变色
我取巧,弄了种很简单的方式
{
option.color: [{
return {
type: 'linear',
x: 0,
y: 0,
x2: 0,
y2: 1,
colorStops: [
{
offset: 0,
color: '#21B8FA'
},
{
offset: 0.8,
color: '#21B8FA' + '00'
}
]
}
}]
}
可以看到,在颜色后面加00即可,也就是透明度大小,换成另一种形式,大家可能看着更熟悉,
#21B8FA → rgb(33,184,250),而加00就是,#21B8FA00 → rgba(33,184,250, 0)
接下来我们来看具体功能点吧
柱状类型
有个配置项,是设置柱状类型的,有两个选项
- 方形
- 子弹头
效果如下
这个很容易实现,通过配置项即可
属性为:seriesitemStyle.borderRadius
borderRadius: 5,
borderRadius: [5, 5, 0, 0]
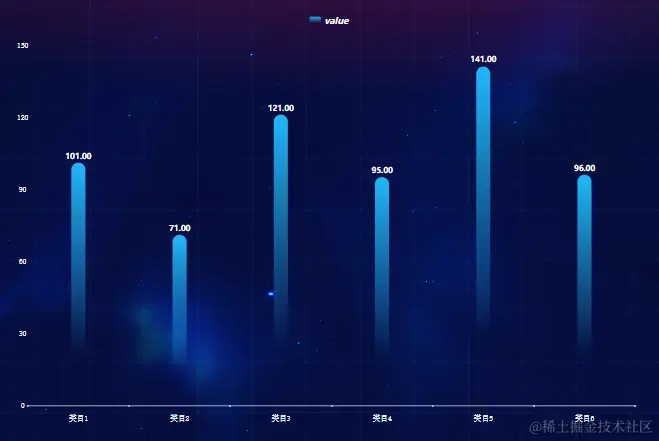
所以方向很明确了,直接设置为[9999, 9999, 0, 0]即可
最终实现效果
顶部装饰
效果如下
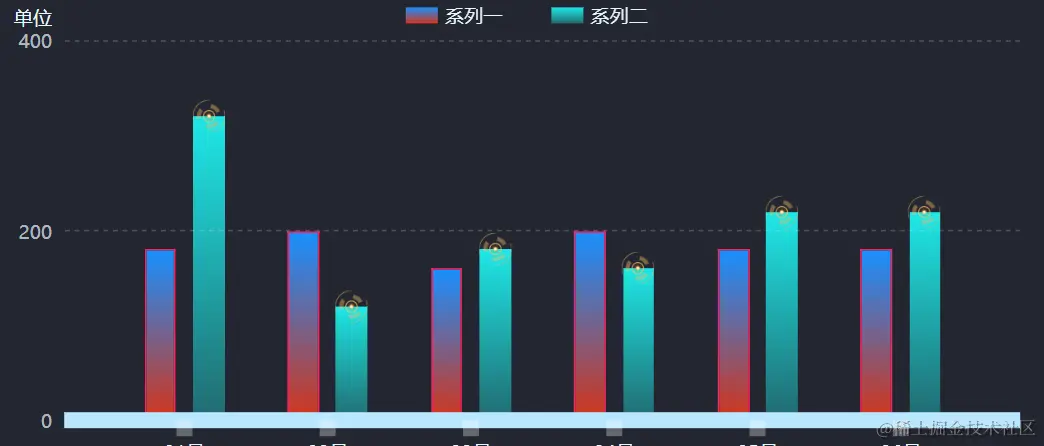
也是有两种实现方式,一种是通过再加一个series去实现,把所有的点换成图片即可
使用的是散点图,我的理解是没有折线的折线图
const headDecoratorSeries = {
silent: true,
animation: false,
type: 'scatter',
symbol: `image://${url}`,
symbolSize: [width, height],
symbolOffset: [offsetX, offsetY],
label: {
show: false
},
itemStyle: undefined
}
然后利用symbolSize和symbolOffset来控制大小和偏移去实现的
另一种方式是通过label的rich属性去实现的,也就是给label添加一个样式,样式里添加背景图片,并控制大小和偏移,具体代码如下
seriesItem.label.formatter = '{bg|{c}}'
seriesItem.label.rich = {
bg: {
align: 'center',
backgroundColor: {
image: url
},
width: width,
height: height,
padding: [offsetX, offsetY]
}
}
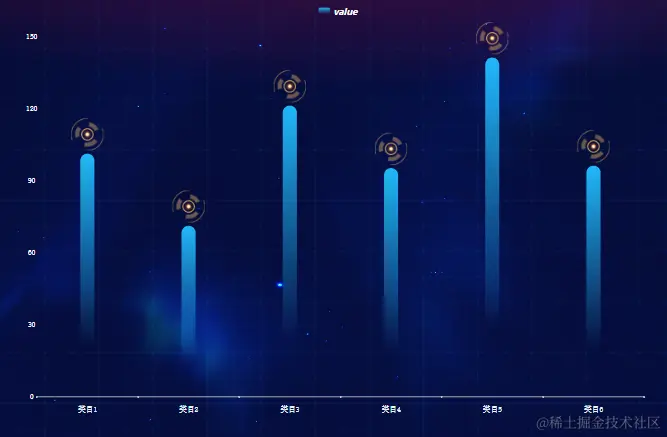
为了性能上的取舍,最终选中了用label的rich去实现的
最终实现效果
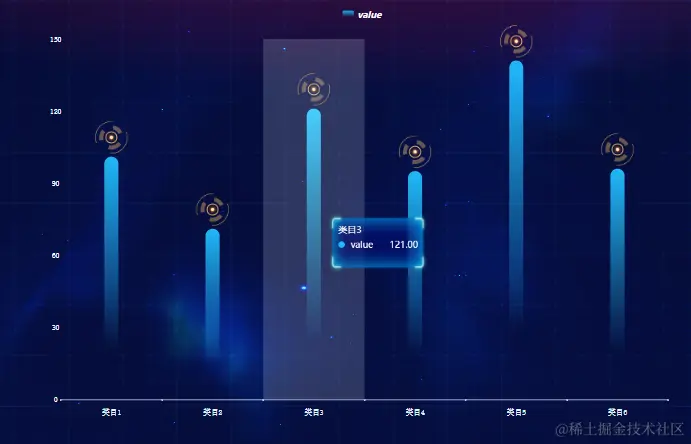
提示框
效果如下
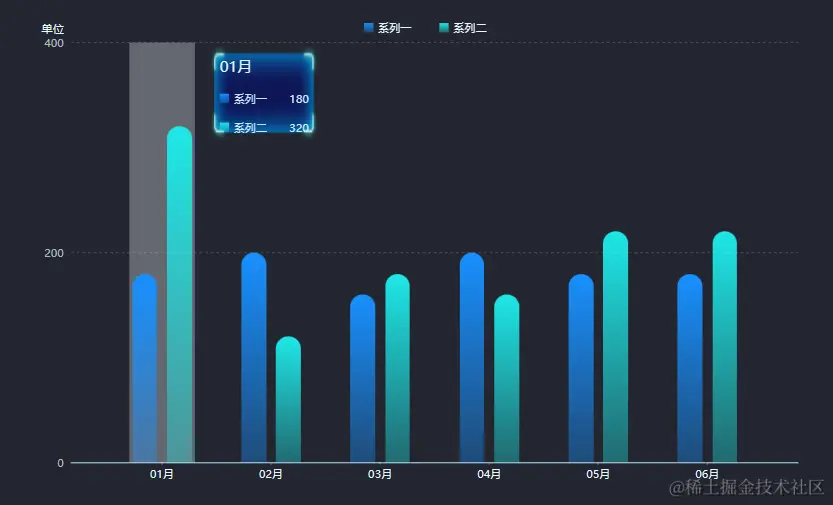
这边的话,主要就是去自定义tooltip的formatter,去自己重新写一个提示框来满足该效果,然后注意系列颜色啥的就好了,其他没啥
我把其中的HTML内容抽离出来
item HTML
<div style="display: flex;justify-content: space-between;align-items: center;">
<p style="margin: 0;">
<span style="display: inline-block;margin-right:5px;width: 10px;height: 10px;border-radius: 50%;background-color: ${param.color.colorStops[0].color}"></span>
${param.seriesName}
</p>
<span>${param.value}</span>
</div>
return HTML
<div style="border-radius: 5px;box-shadow: 0 2px 12px 0 rgba(0, 0, 0, 0.1);width: ${width}px;height: ${height}px;transform: translate(${offsetX}px, ${offsetY}px);background: url(url);">
<p style="margin: 0; margin-bottom: 2px;font-family: inherit;">
${params[0].axisValueLabel}
</p>
<div style="display: flex;flex-direction: column;gap: '1px';font-family: inherit;">
${item}
</div>
</div>
最终内容
props.option.tooltip.formatter = params => {
const item = params.reduce(
(sum, param) =>
sum +
`
<div style='display: flex;justify-content: space-between;align-items: center;'>
<p style='margin: 0;'>
<span style='display: inline-block;margin-right:5px;width: 10px;height: 10px;border-radius: 50%;background-color: ${param.color.colorStops[0].color}'></span>
${param.seriesName}
</p>
<span>${param.value}</span>
</div>`,
''
)
return `
<div style="border-radius: 5px;box-shadow: 0 2px 12px 0 rgba(0, 0, 0, 0.1);
width: ${width}px;height: ${height}px;transform: translate(${offsetX}px, ${offsetY}px);
background: `url(${url}) 50% 50% / 100% 100% no-repeat`;
>
<p style='margin: 0; margin-bottom: 2px;font-family: inherit;'>
${params[0].axisValueLabel}
</p>
<div style="display: flex;flex-direction: column;gap: '1px';font-family: inherit;">
${item}
</div>
</div>
`
}
里面包括了设置背景图片、宽高、偏移等功能
最终实现效果
去除提示框自带的阴影效果
首先给tooltip提供一个className
option.tooltip.className = 'echarts-tooltip'
然后用CSS样式设置一下即可
.echarts-tooltip {
box-shadow: unset !important;
}
提示框动画
效果如下
如果看过我之前那篇文字的同学,可能会对这里很熟悉,实现的方式是一样的,只是同时多了个显示提示框的功能
这里我就直接附上代码了,有兴趣的可以去看我的上一篇文章
const timer = useRef<NodeJS.Timer>()
const currentIndex = useRef<number>(0)
const resetSelect = () => {
eChartInstance.current?.dispatchAction({
type: 'downplay',
seriesIndex: 0
})
}
const selectSector = () => {
eChartInstance.current?.dispatchAction({
type: 'highlight',
seriesIndex: 0,
dataIndex: currentIndex.current
})
eChartInstance.current?.dispatchAction({
type: 'showTip',
seriesIndex: 0,
dataIndex: currentIndex.current
})
}
const rotatingAnimation = () => {
if (props.tooltip.isActive) {
clearInterval(timer.current)
timer.current = setInterval(() => {
const dataLen = eChartOption.current?.series[0].data.length ?? 0
currentIndex.current = (currentIndex.current + 1) % dataLen
resetSelect()
selectSector()
}, props.tooltip.duration * 1000)
} else {
resetSelect()
}
}
useEffect(() => {
rotatingAnimation()
return () => {
clearInterval(timer.current)
}
}, [props.tooltip])
这边的实现会比环形图简单不少,少了一些功能
最终实现效果
水球图
这次的内容比较少,所以我就把刚做的这个需求也添加到这次的文章里了 ^_^
实现效果
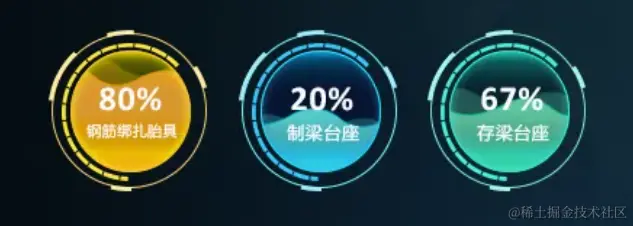
参考案例
看着确实非常酷炫,实现其实也很简单,echarts没有,但有一个这个水球图插件扩展
安装
npm install echarts
npm install echarts-liquidfill
引入
import * as echarts from 'echarts';
import 'echarts-liquidfill'
使用
option = {
backgroundColor: 'transparent',
series: [{
type: 'liquidFill',
radius: '72%',
data: [0.6, 0.6, 0.6],
backgroundStyle: {
color: 'transparent'
},
label: {
show: false
},
outline: {
show: false
},
color: [convertColor(color)]
}]
}
其中文字的话,我是额外附加的,放到一个div里面去处理的
还有一个就是背景图片了,需要根据图表位置进行调整和偏移
最终将其抽离为一个组件,遍历3次即可得到该效果
最终实现效果
好了,今天的内容点就到这里啦🎉🎉🎉 ^_^
如果您觉得这篇文章有帮助,请点个赞吧~
评论
请登录后发表评论
去登录